
Cap Table Math Without Circular Calculations (Introduction)
A way to do cap table math without circular / iterative calculations

Author’s Note: This article assumes a basic familiarity with cap tables. I am assuming you know what a cap table is, have a basic concept of raising venture financing, and have heard the phrases “available option pool”, and “include the pool in the pre-money” mentioned before. I am also assuming you know what fully diluted shares mean.
If the terms I’ve just mentioned feel totally unfamiliar to you, this article may feel daunting. I cover these topics in much more detail in my class. If you’re interested in learning more, you can apply to the course.
If you’ve ever deleted a number in a cell or accidentally moved something in a cap table model only to see #Ref cascade through the file, this post is probably for you. This post is going to show a method for cap table math that does not require circular or iterative calculations, even if you’re refreshing the option pool.
Avoiding circular calculations is valuable, as it lets you create more durable models and makes it easier when modeling out more complex rounds. Why? Let’s discuss:
What is a circular calculation?

Circular / Iterative calculations in Excel can be tricky to wrap your head around. They occur when a formula refers back to its own cell (directly or indirectly), creating a loop. This means Excel has to perform the calculation repeatedly, adjusting the values each time until it converges on a solution (or hits a limit). It’s similar to a “guess and check” process, also known as iterative calculation. To help explain where you’d use an iterative calculation, let’s use an example.
Example: I want to calculate interest expense in a model. I am doing that by taking the average of my debt at the start of the year and my debt at the end of the year, and then multiplying that by an interest rate. To know my debt at the end of the year, I need to know how much cash I have to pay down debt, which requires that I know my interest expense, which requires that I know my debt at the end of the year, which requires that I know my interest expense, which requires….

A circular calculation in Excel lets me solve a problem like this. That said, circular calculations carry risk. If you (even momentarily) mess up a formula (e.g., by deleting a reference or entering the wrong value) it can break your model, often leading to a ton of #REF errors (as it is often called: The New Hire Special).
Fixing a #Ref-ed out model is doable, but can take time and know-how. Not the end of the world, but a pain in the butt. With this in mind, my general approach is that if I can build a model without iterative calculations, I will.
I always compare using circular calculations when they are not needed to deadlifting with bad form. Under a limited amount of weight, it doesn’t matter. That said, when things get heavy, form becomes extremely important.
Cap Table Mechanics: This post will show you how to model out a round of funding that includes an option pool refresh, without needing to use circular calculations.
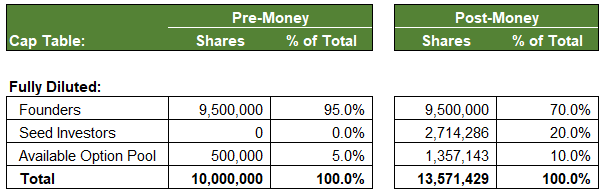
Current Cap Table: A company has 10 million shares. The founders hold 9.5 million shares and the available option pool holds 500,000 shares.
Round Terms: The company raises $5 million at a post-money valuation of $25 million. The new investors receive 20% of the company ($5M / $25M). As part of this round, the available option pool will be refreshed to 10% on a post-money basis.
The Problem: How do we figure out how many shares to create so that the new investors get 20% of the new total and the available option pool gets enough new shares added such that it will be 10% of the new total (including the 500,000 shares already there)?
Process:
1) Calculate the post-money ownership of new investors and the available option pool. This would be 30% (20% to investors + 10% in the available option pool).
2) Calculate the post-money ownership of those who are not the new investors or the available option pool (in this case, that is just the founders). If the new investors + the available option pool is 30% of the post-money share count, then everyone who isn’t those two groups is the other 70% of the total.
3) Now we can calculate the post-money share count for the round. If the founders hold 9.5 million shares, and that is 70% of the post-money total, we can calculate the post-money share count by doing: 9.5 million / 70%. This implies a post-money share count of: 13.6 million shares.
4) We can now calculate the shares received by the the new investors and the post-money available option pool:
Seed Investors = 13.6 million shares x 20% = 2.7 million shares.
Available Option Pool = 13.6 million shares x 10% = 1.4 million shares.
Of the 1.4 million shares in the post-money available option pool, 500,000 already existed. That means we didn’t create 1.4 million new shares—we only added about 900,000 to the 500,000 we started with. If you’re curious what this means for dilution, this post that can help you think through it.
Conclusion: The method above side steps any circular calculations. For a simple model, the difference between circular and non-circular math is, in all honesty, not game changing. That said, when rounds start to get more complicated, the ability to minimize or remove iterative calculations is crucial to managing complexity.
This post only shows a small part of how you can reframe cap table math to make models easier to leverage. To learn more about different round structures and see how these ideas scale up to more complex rounds, I encourage you to look into my course (website).
Like deadlifting with bad form, using circular calcs when you don’t need to won’t hurt until your model gets heavy. This method lets you stay in control as your cap table gets more complex. No Excel setting tweaks or hidden loops required.